|
|
 |

Today, digital computers and other microprocessor-based devices have replaced analog recording and display technologies in all but the simplest data acquisition applications. And while computers have had an undeniably positive impact on the practice of data acquisition, they speak only a binary language of ones and zeroes. Manufacturing processes and natural phenomena, however, are still by their very nature analog. That is, natural processes tend to vary smoothly over time, not discontinuously changing states from black to white, from on to off.
To be meaningfully recorded or manipulated by a computer then, analog measurements such as pressure, temperature, flow rate, and position must be translated into digital representations. Inherently digital events, too, such as the tripping of a motor or a pulse generated by a positive displacement flowmeter, must be made interpretable as a transistor-to-transistor logic (TTL) level changes in voltage. Hence, the origination and ongoing development of input/output (I/O) systems (Figure 1-1) for converting analog and digital information about real-world processes and events into the language of computers.
 |
| Figure 1-1: Functional Diagram for Data Acquisition & Control |
Resolution & Aliasing
Most sensors for measuring temperature, pressure, and other continuous variables provide a continuously varying electrical output to represent the magnitude of the variable in question. To make this signal interpretable by a microprocessor, it must be converted from a smooth continuous value to a discrete, digital number (Figure 1-2).
 |
Figure 1-2: The
Analog-t0-Digital
Interface |
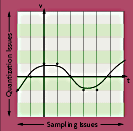
This analog-to-digital (A/D) conversion process poses two primary challenges: one of quantization and one of sampling in time (Figure 1-3). Quantization refers to the uncertainty introduced upon conversion of an analog voltage to a digital number. Measurement transducers or transmitters typically provide continuously varying signals between 0-10 V dc, ±5 V dc, 0-100 mV dc, or 4-20 mA dc. Thermocouples and resistance temperature devices (RTDs) are other common low voltage inputs.
 |
Figure 1-3: A/D
Conversion Compromises |
When this analog value is represented as a digital number, however, this essentially continuous resolution is limited to discrete steps. This resolution of an A/D conversion often is stated in terms of bits-the more bits the finer the resolution. The number of bits determines the number of divisions into which a full-scale input range can be divided to approximate an analog input voltage. For example, 8-bit resolution of a 0-10 V input signal means that the range is divided into 28 = 256 steps. This yields a step, or interval, size of 10 V/256 = 0.039 V. Thus, a 10-V input is equal to the digital number 255 and a 0-V input corresponds to 0. Each 0.039-V change in the input is indicated by adding or subtracting 1 from the previous number. (For example, 9.961 V is digitally represented by 254.)
Digital data acquisition systems not only quantize data in terms of magnitude; time, too, is parceled into discrete intervals (Figure 1-3). In general, there is no information about the behavior of the process between data points gathered. Special precautions, then, must be taken to ensure no meaningful data is lost and interpolation between recorded points remains a valid assumption.
The Nyquist theorem defines the necessary relationship between the highest frequency contained in a signal and the minimum required sampling speed. Nyquist stated that the sample rate must be at least twice the highest frequency component contained within the input signal. So, to sample a 1-Hz sine wave, the sample rate should be at least 2 Hz. (But a rate of 8-16 Hz would be much better for resolving the true shape of the wave.)
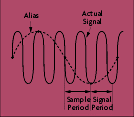
The primary implications of ignoring the Nyquist criterion include not only missing high frequency information but of introducing aliasing; if the sample rate is not fast enough, the presence of totally nonexistent frequencies may be indicated (Figure 1-4). It is aliasing that makes a helicopter's rotors or a car's wheels appear to turn slowly backwards when seen in a movie. Low-pass, or anti-aliasing filters can be used to limit the measured waveform's frequency spectrum so that no detectable component equals or exceeds half of the sampling rate.
 |
Figure 1-4: Aliasing Due
to Slow Sample Rate |
Designing or specifying a device for A/D conversion consists of a series of trade-offs. As will be amply demonstrated in the next section, more resolution (more bits) means more accurate conversion but more expensive hardware. Similarly, slower sample rates mean cheaper A/D conversion, but the Nyquist criterion must still be satisfied.
|


